
Is it safe to reuse this water? ambre puts a number on it.
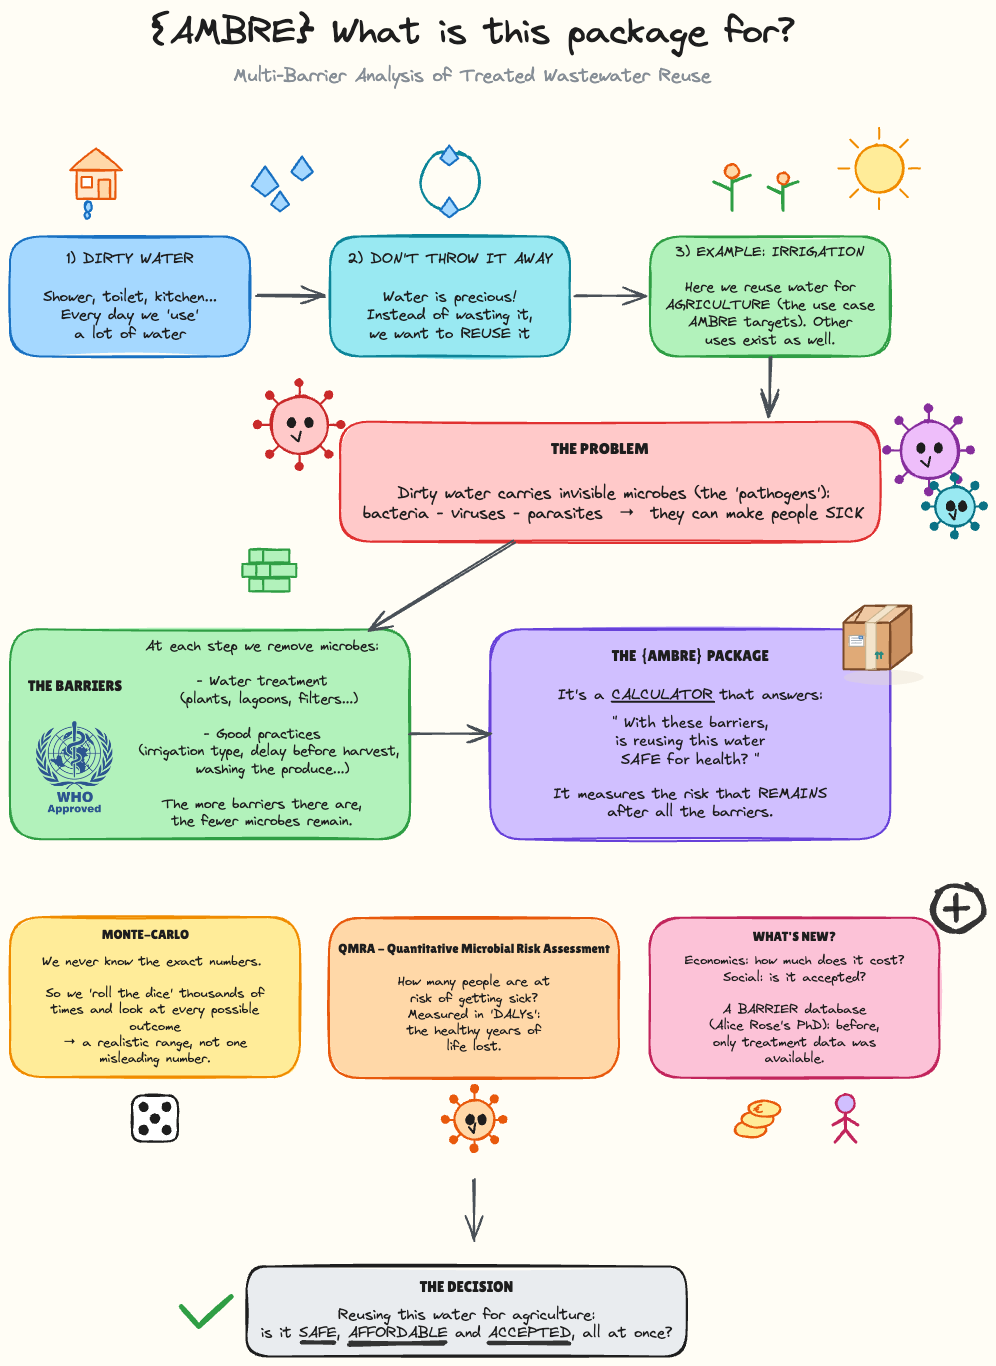
ambre (Approche Multi-Barrières pour la Réutilisation de l’Eau / Multi-Barrier Approach for Water Reuse) is an open-source R package for Quantitative Microbial Risk Assessment (QMRA) applied to the reuse of treated wastewater for agricultural irrigation.
Why ambre?
Reusing treated wastewater to irrigate crops helps face water scarcity, but only if it is safe. Before reusing water, we need to perform risk analysis to define what could be done and how. In real world, risk analysis rely mainly on qualitative assessment, but in labs we use quantitative ones (QMRA), much more precise and helpful for alternative scenarios comparison. But most QMRA tools are complex, consider only one target population at a time, and account for water treatment alone. ambre was built to go further:
- 🔓 Open source. A transparent, reproducible QMRA workflow, from pathogen inflow all the way to DALYs (the healthy years of life lost).
- 🎲 Monte-Carlo, multi-run. Thousands of iterations yield realistic risk ranges instead of a single, fragile number.
- 🧱 Barrier database. Models the full chain of barriers: treatment plants and on-field agricultural practices (from Alice-Rose Thomas’s PhD), where earlier tools only carried treatment data. See The barrier database.
- 💶 👥 Beyond health. Weighs the economic cost and the social organisation to support the reuse scenario, not just the health risk.
Installation
ambre is not on CRAN yet. Install the development version from the INRAE forge:
# install.packages("remotes")
remotes::install_git("https://forge.inrae.fr/reversaal/reut/ambre-package.git")
A typical use case
A reuse scenario (crops, exposed populations, treatment scheme…) is described in an Excel file. The package ships ready-to-run examples; use them as templates for your own scenarios.
1. Health risk (QMRA) accounting for the treatment barriers
The input file should contain the following values:
| CropName | Area | PopulationName | nb_population | PathName | STEPtreatmentName | CollectiveTreatmentName | InitialProcessName | SupplementaryProcessName | nb_day_decay |
|---|---|---|---|---|---|---|---|---|---|
| Tomato | 10 | Maintenance staff | 1 | Ingestion following direct contact with a part of the plant during crop maintenance, followed by hand-to-mouth contact | Q.1 - Activated Sludge | Q.2 - Maturation Pond | Q.6 - Chlorination | E.1.1 - Micro-sprinkler | NA |
| Corn seed | 35 | Maintenance staff | 1 | Ingestion following direct contact with a part of the plant during crop maintenance, followed by hand-to-mouth contact | Q.1 - Activated Sludge | Q.2 - Maturation Pond | Q.6 - Chlorination | P.5 - Natural die-off | 3 |
library(ambre)


plots <- run_qmra_treatment(
  scenario_path = system.file("input_1culture_2pop.xlsx", package = "ambre"),
  pathogen      = c("Campylobacter jejuni", "Norovirus")
)
plots$dalys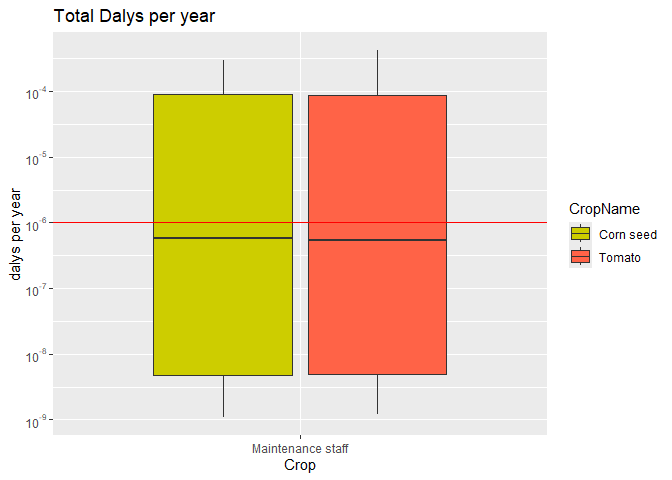
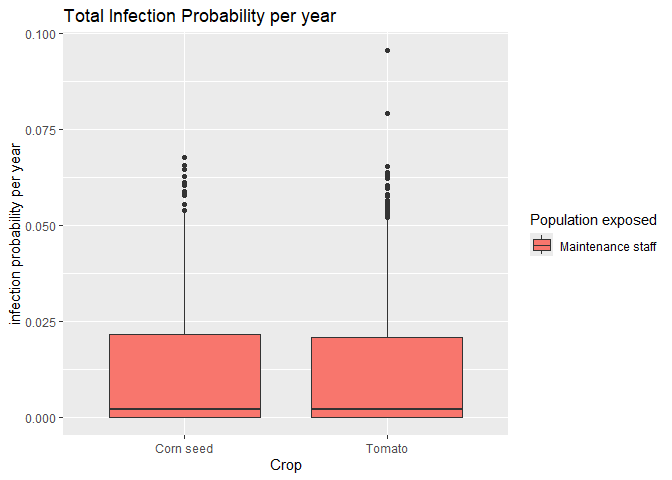
2. Same scenario, now crediting the on-field barriers (practices)
scenario <- create_scenario(system.file("input_1culture_2pop.xlsx", package = "ambre"))
regulation_concentration <- config_ambre$regulation$regulation_value |>
  dplyr::filter(Country == "France") |>
  dplyr::select(-c(Country, RegulationID, Reduction))
run_qmra_supplementary_process(scenario = scenario,
                               pathogen = c("Campylobacter jejuni"),
                               regulationConcentration = regulation_concentration )

# 3. Economic analysis of the scenario
run_economic_analysis(scenario = scenario,
                      price_per_m3 = 0.1,
                      membership_fee = 200,
                      grant = 0.5)
run_qmra_initial_situation() and run_qmra_supplementary_process() each return a named list of ggplot objects (concentration, volume, logreduction, infection_probability, dalys, regulation matrix) so you can inspect every step of the assessment.
The barrier database
The engine behind ambre is an original multi-barrier database that puts a number on every measure a reuse scheme can place between the wastewater and the people exposed to it — not just the treatment plant. It operationalises the database built in Alice-Rose Thomas’s PhD (INSA Lyon, 2024; condensed in the thesis’ Tableau 13) and used in her Multiware participatory simulation tool (Thomas et al., 2024, TSM).
Why it matters
International guidance no longer frames “safe reuse” as a treatment-only problem:
- the WHO promotes a multi-barrier approach and a tolerable health target of ≤ 10⁻⁶ DALY per person per year (WHO, 2006; WHO QMRA, 2016);
- EU Regulation (EU) 2020/741 (applicable since June 2023) sets four reclaimed-water classes (A–D,
E. coli≤ 10 / 100 / 1 000 / 10 000 per 100 mL) and explicitly lets a scheme meet them through additional barriers rather than ever-heavier treatment (EUR-Lex); - France transposed it with the arrêté du 18 décembre 2023 (which repealed the 2010 arrêté and tightened the
E. colithresholds ~100×) (Légifrance); - ISO 16075-2 tabulates barrier log-reductions and “barrier equivalents” (ISO).
ambre’s database turns that qualitative guidance into computable numbers, adding two things the normative texts leave out: per-pathogen-type reductions (rather than a single E. coli indicator) and economic cost.
What’s in it
49 barriers, grouped into the four families of the thesis’ classification:
| Family | What it is | Examples |
|---|---|---|
| 🚰 Quality (17) | treatment processes that lower pathogen concentration | activated sludge, membrane bioreactor, maturation lagoon, sand / micro- / ultra-filtration combined with UV, chlorination or electro-oxidation |
| 🔧 Equipment (14) | physical means deployed on the scheme | micro-sprinkling, surface & subsurface drip, storage, partition cover, signage, access control, automatic irrigation, mechanised maintenance & harvest, PPE |
| 🌱 Cultivation & irrigation practices (12) | how the crop is grown, watered and prepared | 70 m buffer distance, natural die-off before harvest, night-time irrigation, stop-in-strong-wind, non-food crop choice, post-harvest cooking / drying / peeling / washing / disinfection |
| 🛠️ System operation (6) | keeps the chain working over time | training, awareness-raising, health monitoring, microbiological monitoring, equipment maintenance |
Each barrier is described by how it cuts risk and for whom:
- the concentration it removes (log₁₀, per pathogen type — bacteria, viruses, protozoa);
- the exposure it prevents or the volume it reduces, resolved by exposure route (water, air, plant, soil, product) and by exposed population (irrigation, maintenance and harvesting staff; local residents; passers-by; consumers);
- credits that depend on where the edible part sits relative to the emitter (in-soil / at surface / ≥ 25 cm / ≥ 50 cm above);
- and an economic cost (capex/opex, per m³, per ha or per person).
Crucially, every entry is stored as a probability distribution (uniform, normal, …) rather than a point estimate — this is what powers ambre’s Monte-Carlo, multi-run engine and lets it report a risk range. A few illustrations drawn from the data:
- Activated sludge → 1–2 log (bacteria/viruses), 0.5–1 log (protozoa); ultrafiltration + UV + chlorination → up to ~16 / 12 / 9.5 log.
- Subsurface drip → ~0 log when the edible part is in the soil, but ~6 log once it sits ≥ 25 cm above the buried emitter.
- Waiting for natural decay → up to ~1–2 log credited to field die-off between the last irrigation and harvest.
- Costs, e.g. maturation lagoon ≈ 3.5 €/m³ (capex) + 0.07 €/m³/yr (opex); subsurface drip ≈ 7 933 €/ha + 68 €/ha/yr; perimeter sign ≈ 90 €/ha; gloves ≈ 70 €/person.
Where it lives
The database ships as five CSVs in data-raw/, assembled into the bundled config_ambre dataset:
File (data-raw/) |
config_ambre slot |
Content |
|---|---|---|
ambre_barriere_general.csv |
treatment$processes |
log₁₀ concentration reduction, per barrier × pathogen type |
ambre_barriere_voie.csv |
treatment$barriere_path |
exposure / volume reduction, per route × population |
ambre_barriere_specifique.csv |
treatment$barriere_specific |
crop-height-dependent credits (irrigation systems) |
ambre_barriere_deperissement.csv |
treatment$barriere_decay |
natural die-off, per crop height × population × pathogen |
ambre_barriere_cout.csv |
economic$cost |
capex / opex, with units |
run_qmra_initial_situation() credits only the curent situation, while run_qmra_supplementary_process() evaluates the additional measures relating to Quality, Equipment, Practices and System operation. That difference is the whole point of the multi-barrier approach: reaching the WHO health target by combining measures across the chain instead of over-treating the water.
Documentation
- User documentation. The {ambre} website gathers the Get started guide and articles built from the package vignettes.
-
Technical documentation. The function reference and the source code on the INRAE forge.
ambreis developed with {fusen}: the source of truth lives in thedev/flat_*.Rmdfiles.
Acknowledgements
ambre is developed at INRAE (REVERSAAL). Its barrier database builds on the PhD work of Alice-Rose Thomas (Application de l’approche Multi-barrières pour la réutilisation des eaux usées traitées, INSA Lyon, 2024) and the associated Multiware tool. Released under the MIT license.