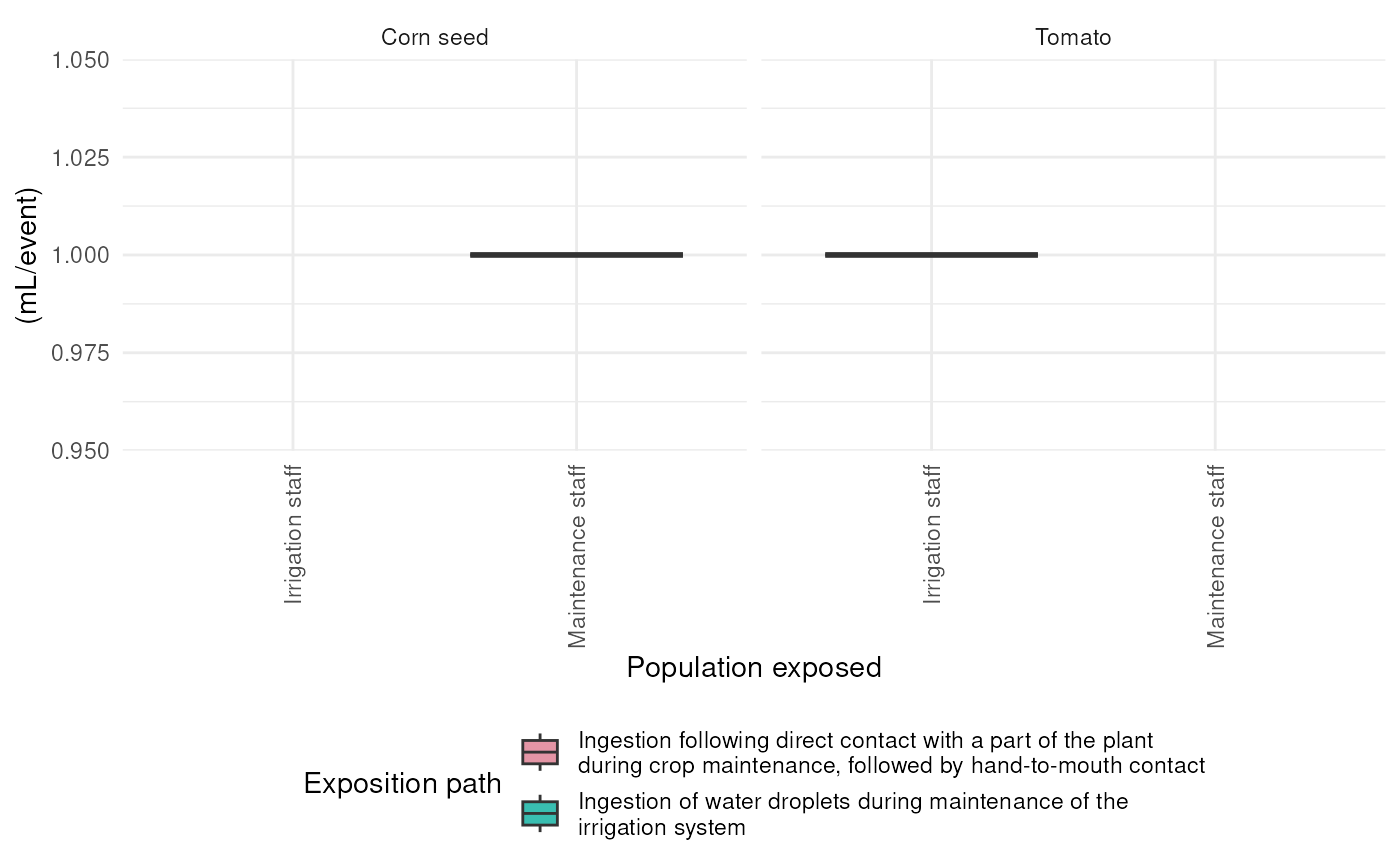
Plot volume
plot_volumes.RdBoxplot of the volume of exposition for each population exposed
Examples
library(dplyr)
library(purrr)
scenario_test <- create_scenario(system.file("input_1culture_2pop.xlsx", package = "ambre"))

scenario_conc <- inflow_concentration(scenario = scenario_test,
 pathogenName = c("Campylobacter jejuni"))
#> Simulated pathogen: Campylobacter jejuni
#> Create 1000 random distribution(s): uniform (n: 60, min: 100.000000, max: 5000.000000)
#> Providing inflow events ... ok. (0.00 secs)
#> Providing inflow paras ... ok. (0.00 secs)
#> Simulated pathogen: Campylobacter jejuni
#> Create 1000 random distribution(s): uniform (n: 48, min: 100.000000, max: 5000.000000)
#> Providing inflow events ... ok. (0.00 secs)
#> Providing inflow paras ... ok. (0.00 secs)

scenario_volume <-
  scenario_conc |>
  mutate(
    volume = map(
      .x = config,
      .f = ~ simulate_exposure(config = .x)
    )
  )
#> Simulated exposure: volume per event
#> Distribution set from 'triangle' to 'uniform' because 'min' equals 'max'
#> Create 1000 random distribution(s): uniform (n: 60, min: 0.001000, max: 0.001000)
#> Simulated exposure: volume per event
#> Distribution set from 'triangle' to 'uniform' because 'min' equals 'max'
#> Create 1000 random distribution(s): uniform (n: 48, min: 0.001000, max: 0.001000)

plot_volumes(scenario_volume)